
CRMX Dashboards Can Now Show the Numbers That Matter
CRMX general dashboard widgets can now keep permanent filters, use their own date ranges, compare periods, and match the language your team uses.

CRMX general dashboard widgets are no longer fixed views.
You can now edit what a general widget shows, save permanent conditions, give the widget its own date range, compare the current period with the last period or last year, rename it, theme it, and duplicate it for another segment.
The update was announced in the official product changelog on September 24, 2026. The practical benefit is not a prettier dashboard. It is a dashboard that opens on the decision your team actually needs to make.
That distinction matters. A dashboard filled with every lead, every source, every salesperson, and every time period can look impressive while hiding the work that needs attention today.
What changed in CRMX dashboard widgets
General Widgets are the prebuilt dashboard views for areas such as opportunity status, conversion rate, lead sources, tasks, and sales efficiency. They previously showed a fixed view of the underlying data.
The official configuration guide now documents several controls for those widgets.
Permanent conditions stay with the widget
The new Conditions tab can narrow a widget with fields such as:
- assigned user;
- followers;
- tags;
- primary contact name;
- lead value;
- custom fields;
- source;
- attribution.
The available fields depend on the widget and the CRMX module behind it. When a widget supports several conditions, they are combined with AND logic.
These conditions are saved with the widget. They do not disappear when someone leaves the dashboard and returns later.
Each widget can own its time window
A general widget can follow the dashboard-wide date filter or use a date-range override of its own.
The active date property and range appear on the widget face. That helps a viewer see whether a number represents this month, this quarter, this year, or another configured period before interpreting it.
Comparisons can stay visible
Comparison mode can show the current period against the last period or last year. A team no longer needs to rebuild the same comparison every time it opens the dashboard.
Titles, themes, and duplicates make the view easier to use
You can rename a general widget in the language your team understands, apply a theme, and duplicate the widget to create another version for a different audience or segment.
“Opportunity Status” may be technically accurate. “Estimates Waiting for a Decision” may tell the team what the view is for.
Why this matters operationally and financially
The release reduces the distance between a number and an action.
A service manager does not need every opportunity when deciding which estimates need follow-up. A consultant does not need every source when checking whether workshop applicants are moving into consultations. A salesperson does not need the whole team's activity when reviewing personal tasks.
Permanent filters can keep the relevant slice visible. Date labels make the measurement boundary explicit. Comparisons add context. Clear titles tell the viewer why the widget exists.
That can save the repeated work of filtering the same view and reduce arguments caused by two people reading different time windows. It can also make missing follow-up easier to see. The update does not guarantee more revenue, better conversion, or cleaner data. It makes the operating question easier to define and revisit.
The businesses most likely to benefit are:
- teams with several salespeople, technicians, locations, services, programs, or lead sources;
- owners who repeatedly rebuild the same dashboard filters;
- managers who need personal and team views from the same underlying data;
- businesses that review lead response, appointment, estimate, proposal, renewal, or referral follow-up;
- CRMX implementers who need a client-facing dashboard to use the client's language.
Use the CRMX FOCUS method
The feature supplies the controls. The CRMX FOCUS method turns those controls into an operating view.
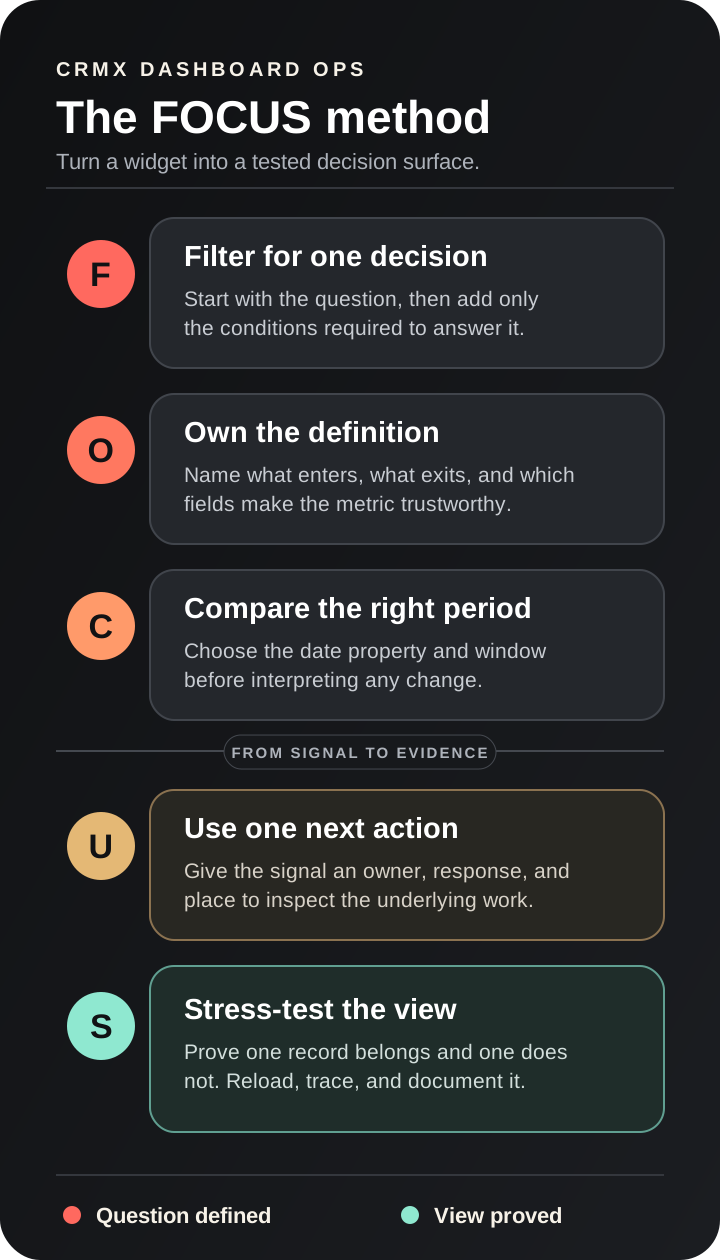
1. Filter for one decision
Start with the question the viewer must answer.
Useful questions include:
- Which estimates assigned to me still need a next step?
- Which consultation leads came from the workshop?
- Which referral opportunities are moving differently from paid leads?
- Which tasks belong inside the current quarter?
Do not begin with every field the system can filter. Begin with one decision and add only the conditions required to isolate it.
2. Own the metric definition
Write down what the widget includes and excludes.
If the title says Open Estimate Follow-Up, decide which tag, source, custom field, assigned owner, or other supported value makes a record eligible. Decide how a won, lost, invalid, duplicate, or test record leaves the view.
The dashboard cannot repair an undefined process. A clear widget exposes the definition your team is already using.
3. Compare the right period
Choose the date property and time window that match the question.
A widget about leads created this month should not be interpreted as a report on jobs completed this month. A quarterly task view should not silently change because someone adjusted the dashboard to last year.
Use a per-widget override when the time boundary should remain stable. Use comparison mode only when the prior period is genuinely comparable.
4. Use one next action
Every operating widget should lead to a defined next step.
If the number rises, who investigates? If the queue is empty, is that good news or a broken filter? If a salesperson sees only personal records, how does a manager review the team? If a follow-up segment is growing, where does the team open the underlying contacts or opportunities and act?
The dashboard is a signal surface. The real work still happens in the record, conversation, task, workflow, or pipeline.
5. Stress-test the view
Use known records before trusting the widget.
Select one record that should appear and one that should not. Confirm the assigned user, tags, source, custom fields, date property, and status that matter. Save the widget, reload the dashboard, change the dashboard-level date filter, and verify that the widget still follows the intended rules.
Then document the test. A familiar number is not proof that the filter is correct.
Example 1: home-service estimate follow-up
An HVAC company wants a morning view for estimates that still need a decision.
The team already applies an Estimate Sent tag when an estimate leaves CRMX and removes or replaces that state when the opportunity is won, lost, or closed for another reason. Each open record has an assigned owner.
The manager creates a general opportunity widget and, where those fields are available for that widget, uses conditions for the estimate tag and assigned owner. The widget is renamed Estimates Waiting for a Decision. The date property and current-month range are made explicit.
The team then duplicates the widget for two useful views:
- a personal view using Assigned user = Logged in user;
- a manager view for the team segment the manager owns.
Every morning, the salesperson opens the personal view, reviews the underlying opportunities, sends the appropriate estimate follow-up, records the outcome, and clears the open state when the customer decides.
The dashboard does not send the message or prove the customer received it. It keeps the defined follow-up queue visible so the owner can act and the manager can inspect whether the process is moving.
For the full sequence behind that queue, use the 7-Day Estimate Follow-Up Ladder.
Example 2: coach or consultant consultation follow-up
A business consultant runs a monthly workshop that leads to strategy-call applications.
The consultant wants to separate workshop-sourced opportunities from other consultations without rebuilding the filter each week. The team already records the source and uses a consistent tag for workshop applications.
The operator duplicates a general widget, adds the supported source and tag conditions, names it Workshop Applications This Month, and sets the date range to the current month. A second widget shows the same defined segment with a comparison to the last period.
The weekly review asks three questions:
- Are new workshop applications entering the intended pipeline?
- Does every application have a visible owner and next action?
- Are completed consultations moving to a decision, nurture, or respectful exit state?
If the dashboard count and the known records disagree, the team checks the source value, tag application, date property, and workflow entry path before drawing a conclusion.
The widget gives the consultation process a stable measurement surface. The CRMX DECIDE Path for proposal follow-up gives the team a next-action model after the conversation.
How to edit a general widget in CRMX
Use one duplicated widget first so the team can compare the new view with the existing one.
- Open the correct CRMX subaccount.
- Go to Dashboard.
- Select Edit dashboard in the top-right corner.
- Hover over the general widget you want to change.
- Open the three-dot menu and select Edit.
- In Configure, rename the widget and choose a date-range override when needed.
- In Conditions, add only the supported fields required for the decision.
- In Themes, apply a visual treatment that remains readable and consistent with the dashboard.
- Save the widget.
- Reload the dashboard and confirm that the conditions persist.
- Check the date property and range shown on the widget face.
- Test known included and excluded records.
- Confirm that the person viewing the dashboard understands the title, scope, owner, and next action.
If you need a second segment, duplicate the verified widget and change one deliberate condition. That is easier to audit than building several unrelated views at once.
Limits and rollout notes
The release is generally presented as current subaccount dashboard behavior. The official sources do not state a beta, Labs, phased, regional, agency-only, or plan restriction for these editable general widgets.
Several product boundaries still matter:
- Condition fields vary by widget. A field available in one module may not be offered in another.
- Multiple conditions use AND logic. Every saved condition must match for a record to remain in the view.
- Pipeline remains a runtime filter. The official guide says it is not included in the permanent Conditions tab when the widget already provides a pipeline control.
- General widgets do not currently respond to dashboard Quick Filters. Saved conditions and dashboard Quick Filters are not the same layer.
- Date-range overrides can ignore the dashboard-wide date choice. That is useful only when the widget label makes the difference obvious.
- Edits are dashboard-specific. Changing a widget on one dashboard does not change the same widget type on another dashboard.
- A widget is not a data-quality fix. Missing owners, inconsistent tags, stale opportunities, bad sources, and test records can still produce misleading numbers.
- A comparison is context, not causation. A change from the prior period does not explain why the change occurred.
Where CRMX AI employees fit
An AI employee can help carry out a defined follow-up role: answer a lead, qualify the request, book an appointment, continue an approved conversation, or route a handoff.
The new dashboard controls help the human team inspect the operating system around that role. A widget might show a defined queue of leads waiting for a reply, appointments needing recovery, or proposals awaiting a decision when the underlying data supports that view.
The dashboard does not prove that an AI response was correct, that a message delivered, or that the customer received a complete answer. Review the underlying conversation and outcome before treating the number as performance evidence.
Dashboard widget QA checklist
Before the team relies on a filtered general widget, confirm:
- The widget answers one named operating question.
- Its title uses language the viewer understands.
- Included and excluded records are defined.
- Every saved condition is necessary.
- The team understands that several conditions use AND logic.
- The chosen date property matches the question.
- The date range or override is visible and intentional.
- The comparison period is genuinely useful.
- Pipeline filtering is handled through the widget's runtime control when required.
- The view does not depend on unsupported dashboard Quick Filters.
- One known included record appears.
- One known excluded record stays out.
- A refresh does not remove the saved configuration.
- The widget's number can be traced to underlying records.
- One person owns the next action when the signal changes.
- The test date, dashboard, widget, filters, expected result, and actual result are recorded.
Frequently asked questions
Which general widget fields can I filter?
The official guide lists assigned user, followers, tags, primary contact name, lead value, custom fields, source, and attribution among the available condition fields. The exact list varies by widget and module.
Do permanent conditions replace runtime filters?
No. Saved conditions are a permanent data layer. Runtime controls on the widget face can still work separately. Pipeline, for example, remains a runtime filter where that control is available.
Will a date-range override follow the dashboard date filter?
No. The purpose of the override is to keep that widget on its own time window even when someone changes the dashboard-level filter. The widget face shows the active date property and range.
Can I compare the current period with an earlier period?
Yes. The release documents comparisons with the last period or last year. Confirm that the periods are operationally comparable before interpreting the difference.
Does editing a widget change other dashboards?
No. The official guide says edits are scoped to the dashboard containing that widget.
Do general widgets respond to dashboard Quick Filters?
Not currently. The release notes explicitly identify Quick Filter support for general widgets as a future improvement.
Turn a dashboard into a decision surface
The most useful dashboard is not the one with the most numbers. It is the one that helps the right person see the right state, understand the time boundary, and take the next action.
Filter for one decision. Own the definition. Compare the right period. Use one next action. Stress-test the result.
That is how editable widgets support the CRMX Revenue Flywheel: the team can keep important follow-up and conversion signals visible without rebuilding the same view every time.
Explore the CRMX platform to see how dashboards, workflows, conversations, pipelines, and AI employees work together. If you want help turning those pieces into one lead-to-customer operating system, request a live CRMX strategy demo.